


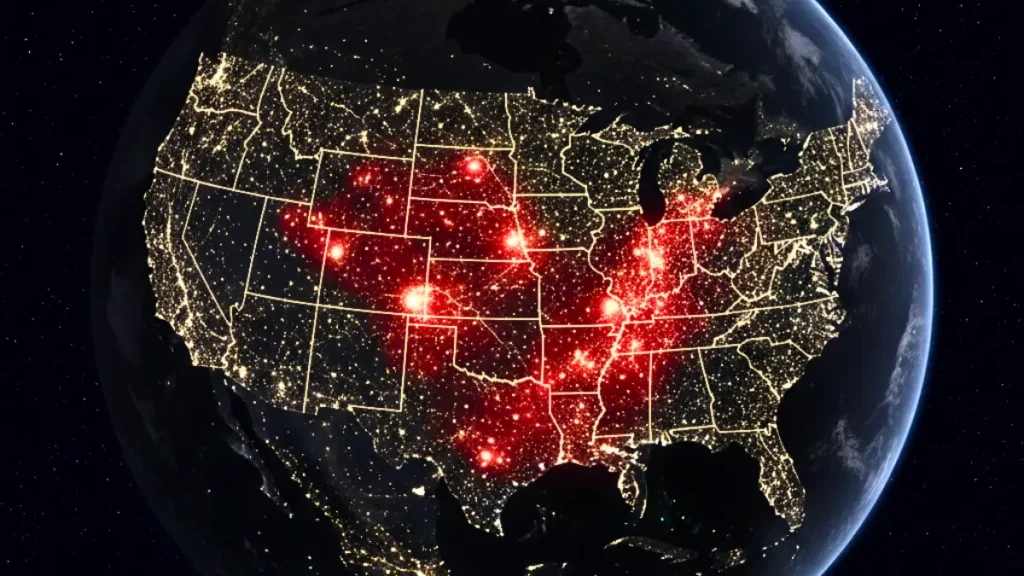
America’s most detailed carbon map exposes where fossil fuel pollution is worst, why Vulcan emissions dataset faces political pressure, and how industries can still reduce CO₂ without harming production.
Why Measuring Carbon Pollution Has Never Mattered More
When it comes to climate change, measurement is power. If emissions cannot be tracked accurately, they are far easier to ignore. At a moment when U.S. federal efforts to monitor carbon pollution face growing political pressure, a new scientific release is offering rare clarity.
The Vulcan Emissions Dataset, developed over two decades, maps fossil fuel carbon dioxide emissions across the United States with extraordinary precision.
Its latest update reveals exactly where pollution is concentrated and why transparent emissions data may matter more now than ever for communities, policymakers, and taxpayers alike.
What the Vulcan Emissions Dataset Reveals
Published in Nature Scientific Data, the fourth version of the Vulcan dataset represents one of the most detailed national emissions inventories ever produced.
Instead of relying on state or regional averages, Vulcan captures carbon dioxide emissions from fossil fuel combustion at an exceptionally fine scale, including individual power plants, factories, road segments, and even city blocks.
The project is designed to support a clearer understanding of the U.S. carbon budget by identifying where emissions originate and how they change over time.
This level of clarity has become increasingly important as climate researchers and policymakers debate how the country should balance economic growth with long-term emissions accountability.
America’s Carbon Pollution Hotspots, Mapped With Unmatched Precision
The newly released map focuses on fossil fuel CO₂ emissions from 2022, and the patterns are striking. The highest emissions appear across the eastern half of the United States, where population density and industrial activity are greatest.
Dense corridors along the East Coast glow red, as do major metropolitan areas such as Dallas, Texas.These hotspots are not abstract zones. They represent neighborhoods, highways, and industrial districts where emissions are concentrated day after day.
According to the research team, Vulcan’s outputs are so detailed that they require high-performance computing systems, generating terabytes of data to reflect real-world activity with unprecedented accuracy.
This kind of granular insight also strengthens emerging strategies discussed in how the U.S. carbon removal boom is colliding with climate reality, where identifying precise emissions sources is critical for effective intervention rather than symbolic action.
Why Emissions Data Is Under Threat And Why Transparency Still Matters
The release of Vulcan’s latest dataset comes amid growing uncertainty over federal emissions reporting. In recent months, the Environmental Protection Agency proposed ending its Greenhouse Gas Reporting Program, arguing that doing so would reduce regulatory costs for businesses.
Critics warn that losing this program would weaken public oversight and limit access to emissions data that informs climate policy. Researchers behind Vulcan argue that this is precisely why independent, publicly accessible datasets are essential.
As one project leader noted, U.S. taxpayers ultimately fund much of this research and have a right to understand how pollution affects their communities.
Public concern over emissions transparency has also surfaced beyond academic circles, as climate leaders have warned that rolling back reporting requirements could obscure the true scale of U.S. carbon pollution.
The Vulcan Emissions Dataset maps U.S. carbon pollution at an unprecedented block-by-block level.
Accurate measurement also underpins ecosystem-based climate solutions, including the Americas’ growing blue carbon revolution
, where trust in data determines policy credibility.
From Data to Action: Cutting Carbon Without Slowing Industry

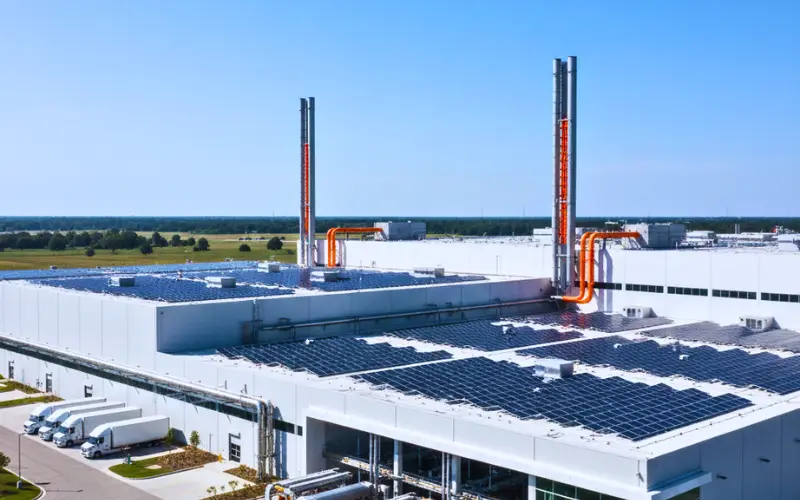
Insights from the Vulcan Emissions Dataset highlight practical ways industries can cut carbon emissions while maintaining output.
While the Vulcan Emissions Dataset highlights the scale of the challenge, it also points toward practical solutions. By identifying emissions down to specific facilities and infrastructure, industries can focus on targeted improvements rather than broad cuts that risk economic disruption.
According to industry analysis from Chromalox, companies can reduce emissions through smarter electrification, efficient heating systems, and better monitoring without compromising output. These approaches demonstrate how decarbonization can be operational rather than ideological, especially when guided by high-resolution data.
Independent reporting reinforces how pollution mapping connects emissions to real-world health impacts. According to official updates from The Cool Down, detailed petrochemical pollution maps are increasingly helping communities understand local air quality risks.
These insights align closely with warnings that global air quality is at risk as wildfire smoke and climate pressures intensify.
Final Thoughts
By showing exactly where fossil fuel carbon pollution originates, Vulcan empowers communities, scientists, and industries to act with precision. In the climate fight, transparency is not just informative, it is foundational to accountability, smarter policy, and lasting progress.
Disclaimer: This article is for informational purposes only and does not constitute legal, regulatory, or environmental compliance advice. Interpretations of emissions data may vary based on methodology and ongoing policy developments.


Contents
- 1 America’s most detailed carbon map exposes where fossil fuel pollution is worst, why Vulcan emissions dataset faces political pressure, and how industries can still reduce CO₂ without harming production.
- 2 Why Measuring Carbon Pollution Has Never Mattered More
- 3 What the Vulcan Emissions Dataset Reveals
- 4 America’s Carbon Pollution Hotspots, Mapped With Unmatched Precision
- 5 Why Emissions Data Is Under Threat And Why Transparency Still Matters
- 6 From Data to Action: Cutting Carbon Without Slowing Industry
- 7 Final Thoughts